

What each stage is, the metric that proves it is working, and the 2026 SaaS benchmark to measure against.
The demand generation funnel is how a SaaS marketer turns a stranger into a customer, and knowing its stages is the difference between running campaigns and running a system. This guide defines each stage, names the one metric that proves it is working, and gives the 2026 SaaS benchmark to measure yourself against. No theory for its own sake: every stage here maps to a number you can actually track.
A demand generation funnel is the staged model of how a company creates awareness, nurtures interest, and converts it into revenue, tracked as prospects move from anonymous visitor to paying customer. It maps marketing and sales activity to the buyer journey, usually in three broad stages, top, middle, and bottom of funnel, so each stage can be measured and improved on its own. As Semrush describes it, the funnel is simply the path from first touch to purchase, broken into parts you can optimize.
For SaaS specifically, the funnel has to account for a longer, mostly self-directed buying journey and a subscription model where the sale is the start of the relationship, not the end. That is what separates a SaaS demand generation funnel from a generic one: it is built for multi-month cycles, buying committees, and retention, not a single impulse purchase.
The SaaS demand generation funnel has three core stages: top of funnel (TOFU) for awareness, middle of funnel (MOFU) for consideration, and bottom of funnel (BOFU) for decision. Each stage has a different job, a different type of content, and a different success metric. The model is widely shared, but the SaaS discipline is in measuring the handoff between stages, because that is where pipeline leaks.
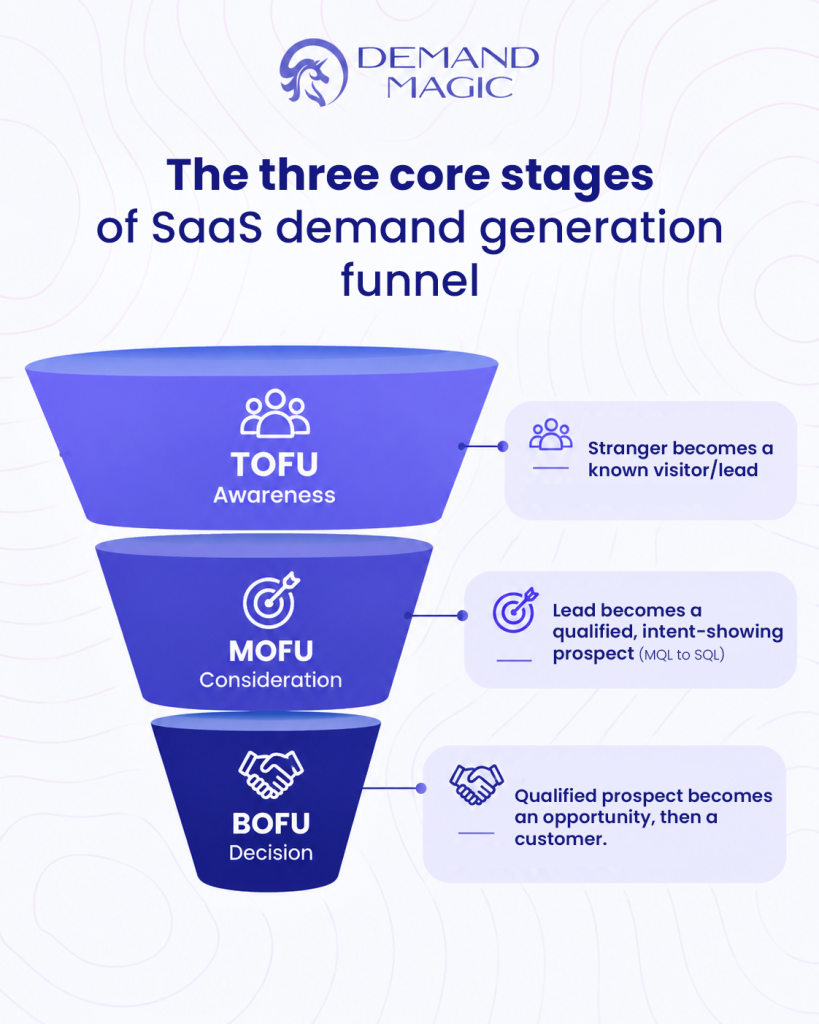
The top of the funnel is the awareness stage, where you attract problem-aware strangers and convert a small fraction into known leads. The audience is broad and early; most are not ready to buy. The job is reach and interest, not to sell. Typical SaaS content: educational blog posts, guides, research, and social content (this article is itself a TOFU asset).
The headline metric is visitor-to-lead conversion rate. The 2026 SaaS benchmark is sobering: per a funnel benchmark analysis of First Page Sage data, the median B2B SaaS visitor-to-lead rate is around 1.4%, while top performers reach 8 to 15%. The gap is mostly intent matching and landing-page quality, not traffic volume, which is why pouring more visitors onto a weak page rarely helps.
The middle of the funnel is the consideration stage, where a known lead evaluates solutions and either qualifies as a real prospect or drops out. The audience is solution-aware and comparing options. The job is to build trust and demonstrate fit. Typical SaaS content: comparison pages, case studies, webinars, ROI tools, and product-led trials.
The headline metrics are lead-to-MQL and MQL-to-SQL conversion. Across a blended SaaS funnel, First Page Sage data compiled by Ruler Analytics puts lead-to-MQL near 40% and MQL-to-SQL near 38%. The MQL-to-SQL step is the most common bottleneck, and a rate far below benchmark usually signals a scoring or definition problem between marketing and sales, not a traffic problem.
The bottom of the funnel is the decision stage, where a qualified prospect becomes an opportunity and then a customer. The audience is decision-ready and comparing final options. The job is to remove risk and close. Typical SaaS content: demos, free trials, pricing transparency, security documentation, and proposals.
The headline metrics are SQL-to-opportunity and opportunity-to-close. The same blended SaaS data puts SQL-to-opportunity near 44% and opportunity-to-close near 36%. Because so few prospects reach this stage, small improvements here move revenue more than equivalent gains at the top, which is why mature SaaS teams protect BOFU conversion first.
Each funnel stage has one headline metric; measured together, they show exactly where pipeline leaks. These are blended B2B SaaS medians for 2026, useful as a starting reference. Segment by motion and ACV before drawing conclusions, because a PLG funnel and a sales-led funnel behave very differently.
| Stage transition | Headline metric | 2026 SaaS median | Top performers |
|---|---|---|---|
| Visitor → Lead (TOFU) | Visitor-to-lead rate | ~1.4% | 8 to 15% |
| Lead → MQL (TOFU/MOFU) | Lead-to-MQL rate | ~40% | 45%+ |
| MQL → SQL (MOFU) | MQL-to-SQL rate | ~38% | 51% (SEO-sourced) |
| SQL → Opportunity (MOFU/BOFU) | SQL-to-opportunity rate | ~44% | 54%+ |
| Opportunity → Close (BOFU) | Win rate | ~36% | Higher deal value |
Read the funnel as a chain: a blended SaaS funnel compounds down to roughly 2 to 4% of leads becoming customers, so the stage with the widest gap to benchmark is where you fix first. For most SaaS companies in 2026, that is the visitor-to-lead step, where the median-to-top-performer gap is largest.
A demand generation funnel covers the full journey from awareness to revenue and beyond to retention, while a sales funnel covers only the later stages where an identified opportunity is worked to a close. As Funnel.io notes, the funnel has many names (marketing funnel, sales funnel, conversion funnel) but the demand-gen view is the widest: it owns the anonymous, pre-sales stages a traditional sales funnel never sees, and for SaaS it extends past the first sale into expansion and retention.
The demand generation funnel turns vague “brand awareness” into a measurable system: three stages, each with a job and a number. For SaaS, the discipline is watching the handoffs, because pipeline leaks between stages, not within them. Once you can see which stage is underperforming its benchmark, you know exactly where to work. For the strategy behind the funnel, see our B2B SaaS demand generation strategy framework, and for how the funnel turns into a pipeline, our guide to SaaS lead generation that drives pipeline.
Top of funnel (awareness), middle of funnel (consideration), and bottom of funnel (decision). TOFU attracts and educates, MOFU qualifies and nurtures, and BOFU converts.
The 2026 B2B SaaS median is around 1.4 to 2%, and top performers reach 8 to 15%. The gap is driven mostly by intent matching and landing-page quality, so it is usually the highest-impact stage to improve.
Fix the stage with the widest gap to benchmark, which for most SaaS teams is visitor-to-lead. Because the funnel compounds, the leakiest stage caps everything below it.
TOFU, MOFU, and BOFU are the three stages of the demand generation funnel. The funnel is the model; TOFU/MOFU/BOFU are the labels for its stages.
| Want help finding and fixing your leakiest funnel stage? As a demand generation agency for B2B SaaS, we build measurable demand funnels mapped to your motion and benchmarks. Book a strategy session → |
 Sam
Sam